EaP Index Methodology
Curious to learn more about how the Eastern Partnership Index was compiled?
At its core, the Index serves as a reliable barometer, measuring the strength and sustainability of democratic institutions and practices across the six Eastern Partnership countries. By combining meticulous data collection with an inclusive approach, we strive to contribute to a deeper understanding of the challenges and opportunities faced by the Eastern Partnership countries.
Delve into all the intricacies of the EaP Index conceptual framework and methodology on this page.
What is behind the EaP Index scores?
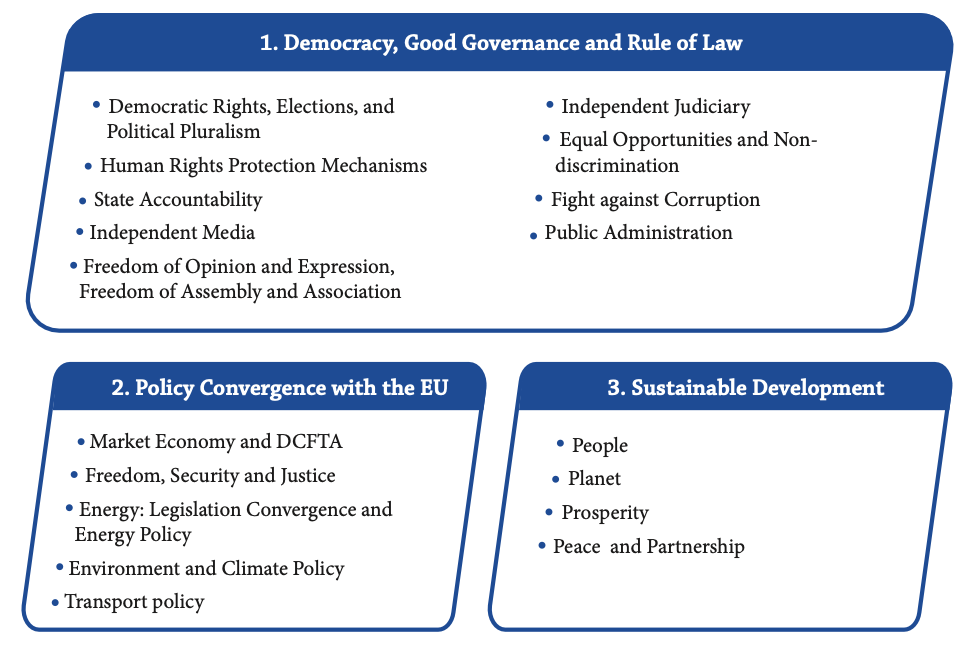
The Eastern Partnership Index (the EaP Index or the Index) measures the progress made by Armenia, Azerbaijan, Belarus, Georgia, the Republic of Moldova, and Ukraine (the six EaP countries) with regards to 1) Democracy, Good Governance and Rule of Law, 2) Policy Convergence with the European Union, 3) Sustainable Development Goals
The EaP Index is based on a composite methodology, with 3 interrelated dimensions categorised into 18 thematic areas and 76 sub-thematic areas. The Index takes cross-cutting issues into account throughout its analysis, with particular attention placed on gender equality and human rights.

EaP Index production and data sources
The Index is a composite analytical tool based on up-to-date facts and primary and secondary data drawn from civil society sources on topics salient to the Eastern Partnership.

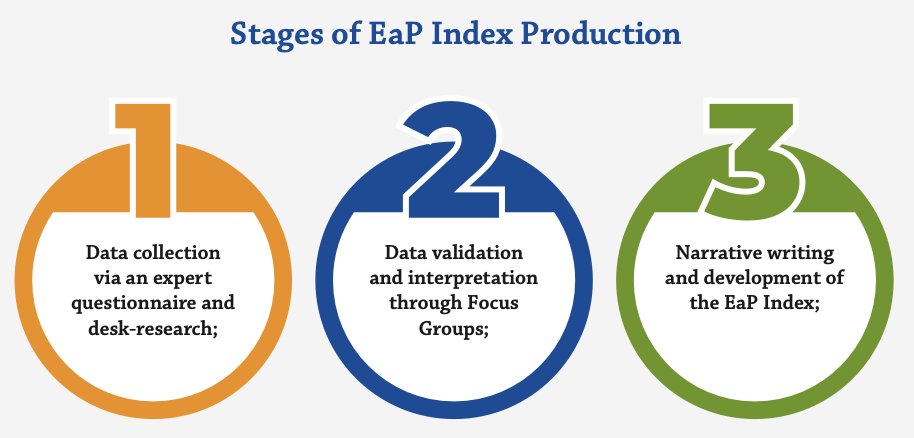
- Data collection
Data collection for the EaP Index involves two components: an expert questionnaire and desk research. The questionnaire, answered by 60+ independent civil society experts, includes over 800 questions on various indicators, with 88 new questions added in 2023 for gender equality. Answers are coded numerically (1 = yes, 0 = no, 0.5 = partially). Desk research complements this by gathering national data, reports, and international indexes, aiming to map new legislation, assess its quality, and inform the Sustainable Development Goals section. Scores ranging from 0.00 to 1.00 reflect positive assessments or lack of progress in measured concepts.
- Data validation and interpretation
Following data collection, online Focus Groups are convened across the EaP Index’s main thematic areas, with local experts from each of the six EaP countries (among which some also hold the role of sectoral coordinators), along with the EaP CSF Index team.
The objectives include cross-checking data for consistency, validating findings with local experts and coordinators, identifying case studies, developing cross-country insights, and generating targeted recommendations. Additionally, preliminary results are compared with previous editions of the EaP Index.
- Narrative writing and EaP Index development
The EaP Index, comprising sectoral reports and country reports, undergoes a meticulous a multi-step development process for unbiased results.
Sectoral coordinators initiate the process by preparing the 1st draft based on the results of the expert questionnaire. Focus group discussions dedicated to each thematic area ensue, leading to a refined 2nd version of the draft.
Editorial review follows, ensuring consistency and quality.
Similarly, country reports go through research, focus group discussions, and editorial review.
The final steps involve peer review by independent reviewers and the preparation of the consolidated EaP Index for publication by the Executive Editor and the Advocacy and EaP Index Manager (EaP CSF).
Data availability
The 2023 edition of the EaP Index covers the period between September 2021 to July 2023, with updates and references to relevant events until November 2023.
Limitations and mitigation measures
In the process of developing each edition of the EaP Index, several limitations have been encountered, namely:
- Data availability and accuracy: Across the EaP region, national authorities do not necessarily collect and report data uniformly, leading to potential discrepancies and challenges in making accurate interpretations and comparisons.
- Challenges in securing independent civil society experts covering some thematic topics: the EaP Index relies on independent civil society experts from the six EaP countries; identifying such experts to cover some thematic areas of the Index pertaining namely to “Policy Convergence with the EU” proved to be challenging in relation to some EaP countries;
- Subjective metrics: the EaP Index relies on expert opinions and authentic insights from local experts and sectoral coordinators from the EaP region. This type of approach to social research may result in instances of unintended bias affecting the scores and rankings.
- Changing dynamics and timeliness: The Index faces challenges in keeping up with the rapidly changing (geo)political, economic, and social dynamics across the EaP countries and their evolving relations with the EU.
To address these limitations, several strategies have been used:
- Improved data collection and validation: consistency, quality and reliability of data have been improved thanks to the use of a new online data collection tool that replaces the former practices; the support of an independent data scientist was also sought to ensure the correctness of calculating scores.
- Open peer review process: the peer review process served as a quality control mechanism enabling the identification and correction of potential errors, biases, and inaccuracies.
You can get a far more detailed explanation of how the EaP Index is compiled by checking The EaP Index Conceptual Framework and Methodology.
Your feedback and questions are welcomed! Please contact us at advocacy@eap-csf.eu.
FAQs
What is the Eastern Partnership Index?
The Eastern Partnership Index (EaP Index or the Index) is a unique data driven civil society produced monitoring tool that charts developments in the six Eastern Partnership countries towards democracy, good governance and rule of law, policy convergence with the EU and sustainable development. The Index is produced by the Eastern Partnership Civil Society Forum with the financial support of the European Union.
What countries make the subject of the Eastern Partnership Index?
The EaP Index looks at the progress of reforms in Armenia, Azerbaijan, Belarus, Georgia, the Republic of Moldova, Ukraine.
How is the Eastern Partnership Index structured?
The EaP Index is structured around three primary thematic dimensions: “Democracy, good governance, and rule of law,” “Policy Convergence with the EU,” and “Sustainable Development.”
In the 2023 edition, an added emphasis on gender is introduced through a dedicated section, providing essential insights and observations on gender equality in the EaP countries based on the Index’s findings.
In addition to its thematic focus, the latest edition incorporates three country-specific chapters that present a comprehensive analysis of the preparedness of Georgia, the Republic of Moldova, and Ukraine to join the European Union. This analysis considers the priorities and steps outlined by the European Union for the Trio in June 2022.
What is the reporting period of the latest edition of the Eastern Partnership Index?
The 2023 edition of the EaP Index covers the period between September 2021 to July 2023, with updates and references to relevant events until November 2023.
Who contributes to the development of the EaP Index?
The EaP Index is developed by independent civil society experts hailing from the six Eastern Partnership countries. Over the course of numerous editions, the EaP Index has fostered a vibrant community of practice.
What is the EaP Index’ approach to data collection?
The EaP Index employs a composite analytical tool based on up-to-date facts and data drawn from primary sources. Civil society experts from all EaP states, alongside the Advocacy and EaP Index Manager and the EaP Index Executive Editor, systematically analyze gathered information using both quantitative and qualitative methods. Data collection is securely managed through the data collection application available on https://opinify.eu/.
How does the EaP Index combine quantitate and qualitative methods in its analysis?
The Index uses quantitative fact-based indicators gathered through an expert questionnaire comprising more than 800 questions and in-depth desk research, along with qualitative insights from expert thematic assessments and observations made by focus groups.
How are expert assessments coded and what do numerical scores represent?
In the expert questionnaire, scale answers are coded as numerical scores ranging from 0 (zero) to 1 (one). “Yes” corresponds to 1, “No” to 0, and “Partially” to 0.5. Higher scores indicate more positive assessments regarding democracy, policy convergence, sustainable development, and related aspects. In some instances, the principle of inverse standardisation is applied.
In the EaP Index, all aggregate scores and overall results range from 0 (zero) to 1 (one).
Is the dataset of the latest EaP Index 2023 edition available for further consultation?
Yes, the dataset is available for further consultation at: https://eap-csf.eu/2023-index-dashboard/
Is the dataset of the EaP Index 2023 edition visualised?
Please check: https://eap-csf.eu/2023-index-dashboard/
The dashboard has been produced using PowerBI powered by https://opinify.eu/. To maximise your understanding of all features of the dashboard, please check the user guide available at: https://eap-csf.eu/wp-content/uploads/EaP-Index_dashboard_user-guide-1.pdf
In case of further questions and feedback, whom can I contact?
For any questions, please contact the Eastern Partnership Civil Society Forum at advocacy@eap-csf.eu.
Contact us
Alexandra Sabou
Advocacy and EaP Index Manager
Email: alexandra.sabou@eap-csf.eu
Tel: +32 487 42 11 31
